Dashboard and monitoring
Admin → Dashboard is the health picture: live tiles for active calls (against your licensed maximum), extension and trunk registration, CDR volume, recording and disk usage — plus system information (FQDN, addresses, install type, uptime, license) and the storage/maintenance panel.
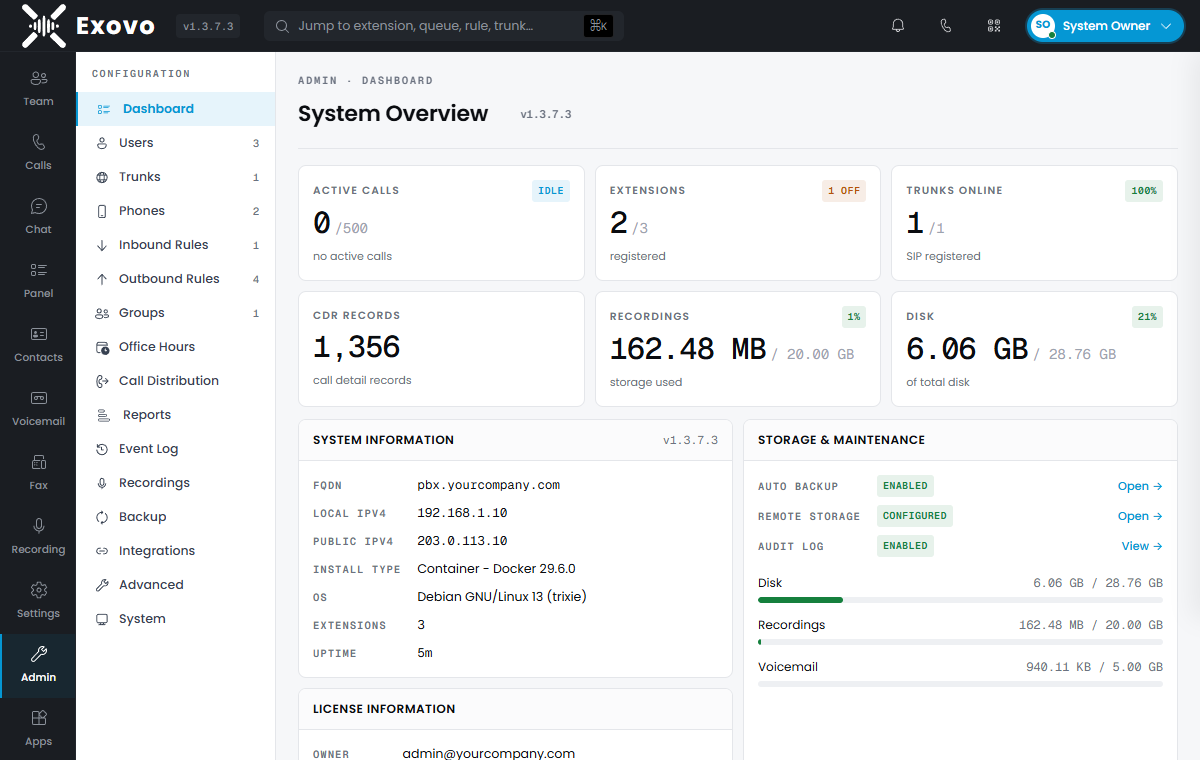
Two banners surface things that need you: a license banner when enforcement is active, and an update banner when the registry has newer components.
Services
Dashboard → Services watches the containers themselves — per-service status, CPU, memory and network, with scoped restart actions. It's the "is the telephony core actually up" view, one level below the application tiles.
Event log
Admin → Event Log is the running record: phone registrations, trunk and bridge up/down transitions (periodic re-registrations are deliberately not logged), security events (anti-hacking blocks, blacklist hits, toll-fraud rejections), emergency calls, resource thresholds, backup outcomes. Every entry is a named event from a fixed catalogue with a severity and a source, so you can filter by source or event type, page through history, and expand any row for its structured details (the IP, the trunk, the threshold that tripped). Retention is set on the page itself — events older than the limit are trimmed automatically. When something "was weird yesterday," this is where yesterday still exists.
Maintenance and data purges
Admin → System → Maintenance shows how much database space the growing logs consume — call history, chat history and the event log — each with a Purge button, plus a Purge All. Purging permanently deletes every row in that category; it can't be undone, and each purge is recorded in the audit log. Reach for it when a table has grown huge or before you repurpose a box.
Voicemail is purged separately on Admin → System → Voicemail: Purge clears every user's messages at once, or set automatically delete voicemails older than a number of days to keep the store trimmed without manual runs.
Reports
Admin → Reports catalogs the call-statistics reports (queue performance, agent activity, call volumes) by category — the analytical companion to the panel's live wallboard.
Scheduled reports
Admin → Reports → Scheduled Reports emails a report to a list of recipients on a schedule as a CSV attachment, generated automatically. Pick a report (call log, inbound/outbound calls, queue callbacks, or failed callbacks), a cadence (daily, weekly on a chosen day, or monthly on a chosen date) and a time, how many days back it should cover, and the recipients. Times are in the system's timezone and stay put across daylight-saving changes. Pause a report without deleting it, or Run now to send one immediately (handy for checking recipients and email are set up). Sending requires SMTP to be configured.
Alerts: monitoring that finds you
Admin → System → Alerts turns events into email:
- System thresholds — CPU, memory, disk and recording-quota percentages. Each raises an Event Log entry when crossed and clears once the value drops back below the threshold with a small margin, so a value hovering at the line doesn't flood you.
- Which events to send — choose a minimum severity (everything at or above it is emailed) and, independently, subscribe to specific events from the catalogue: a trunk going down, an SBC dropping, a blocked-country attempt, a backup result. Emergency calls are always sent. Repeats of the same event for the same object are held back for 15 minutes.
Recipients are the system admins, optionally owners, plus any extra addresses. Five minutes configuring this page is the difference between "the trunk failed over at 2 AM and the morning shift never knew" and an email at 2:01.
Remote syslog
Admin → Integrations → Remote Syslog streams events and audit records to an external syslog collector (SIEM, log aggregator, compliance archive) as RFC 5424 messages over UDP, TCP, or TLS. Choose which streams to forward — System alerts, PBX alerts, and audit logs — independently. Test connection sends a probe message, and the page shows a live count and the time of the last forward. Delivery is best-effort and never blocks the PBX: if the collector is unreachable the forwarder reconnects with backoff, and a full internal buffer drops the oldest records rather than stalling. For TLS, the collector's certificate must be trusted by the system.
Data connectors
Admin → Integrations → Data Connectors exports call records — and, optionally, recording metadata
— to an external PostgreSQL database for reporting, analytics, or long-term archival. Give it the
connection details (the password is stored encrypted), choose what to export and a schedule (hourly,
every 6 or 12 hours, or daily at a set time), and Test connection to verify it. The connector
creates the target tables (exovo_cdr, exovo_recordings) itself and exports incrementally from
where it left off; re-runs are safe because inserts are idempotent. Delete transferred data removes
the exported rows from Exovo once they're safely in the external database (off by default). The page
shows when the last export ran and any error. Only data Exovo actually stores is offered — call records
and recording metadata; there are no system- or audio-metric tables to export.